
Introducing the Security Metrics Toolkit
Security metric program reporting in under 10 minutes

Information security teams track all sorts of metrics. The problem? No two teams track the same set. Different controls, goals, requirements, and tools means every program looks different.
Yet, across SMBs and Fortune 500s alike, one thing is consistent: everyone uses Excel. And honestly, it makes sense.
The Security Metrics Toolkit builds on that reality. It gives you a simple way to run a complete security metrics program while staying grounded in Excel. And when you’re ready to automate, you can migrate certain metrics into data pipelines and APIs without breaking the rest of your program.
In short: the toolkit handles the reporting and dashboards, so you can focus on defining what matters, how to measure it, and why it matters.
Providing Structure & Consistency
Most metrics programs are ad hoc. Lots of good intentions, but they don’t have a common structure. The Toolkit solves this.
It’s built on the methodology from NIST SP 800-55, “Measurement Guide for Information Security”, which organizes metrics into four categories:
Implementation
Effectiveness
Efficiency
Impact
It also gives you a framework for maintaining a formal metrics inventory. Each metric can be documented with:
Unique ID
Status (Active/Inactive)
Dates added/updated
Type and category
Title and purpose
Calculation and target
Measurement frequency
Owner and data sources
Retirement dates and reasons
That structure is what turns scattered measurements into a sustainable program.
Simple Measurement Log
At the heart of the Toolkit is a unified measurement log. The schema is deliberately simple:
Metric ID
Measurement value
Measurement date
Optional notes
Manual logging may feel old-school, but it comes with a hidden benefit: accountability. The person responsible for recording the metric isn’t always the same as the person accountable for the outcome. By keeping that distinction clear, you avoid the common pitfall of owners pushing back or disputing measurements.
Of course, not everything needs to be manual. When you’re ready, the log schema supports automated data pulls from APIs, databases, or data lakes, seamlessly feeding into the reporting.
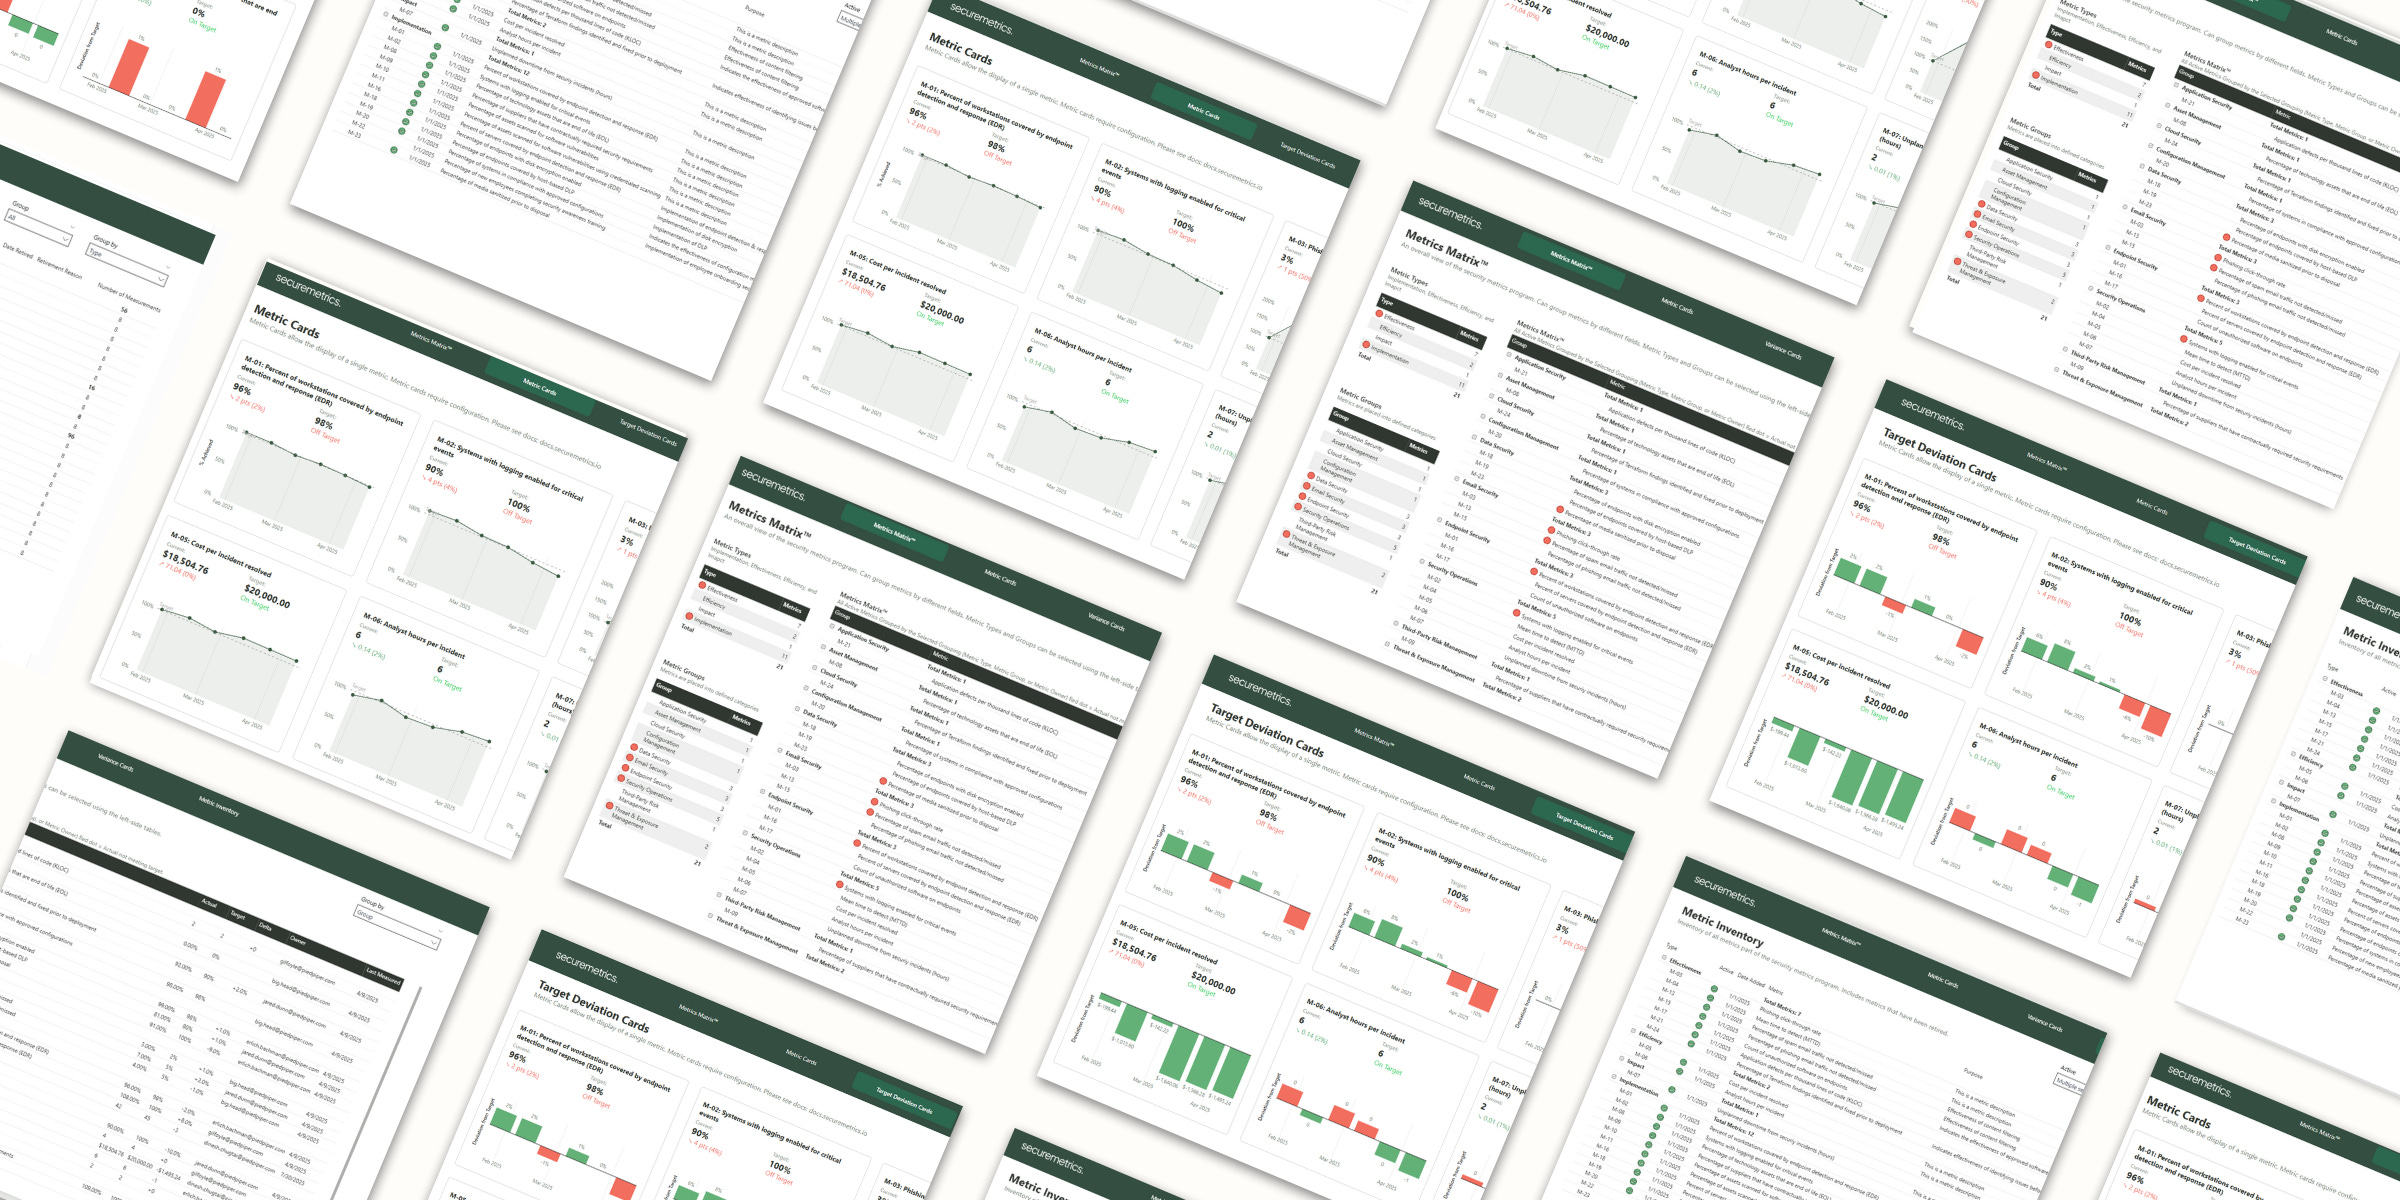
Intuitive Reporting That “Just Works”
The Toolkit’s biggest advantage is time saved on reporting. No more ad hoc Excel charts or endless PowerPoint slides. Instead, you get three ready-to-use views:
1. Metrics Matrix™
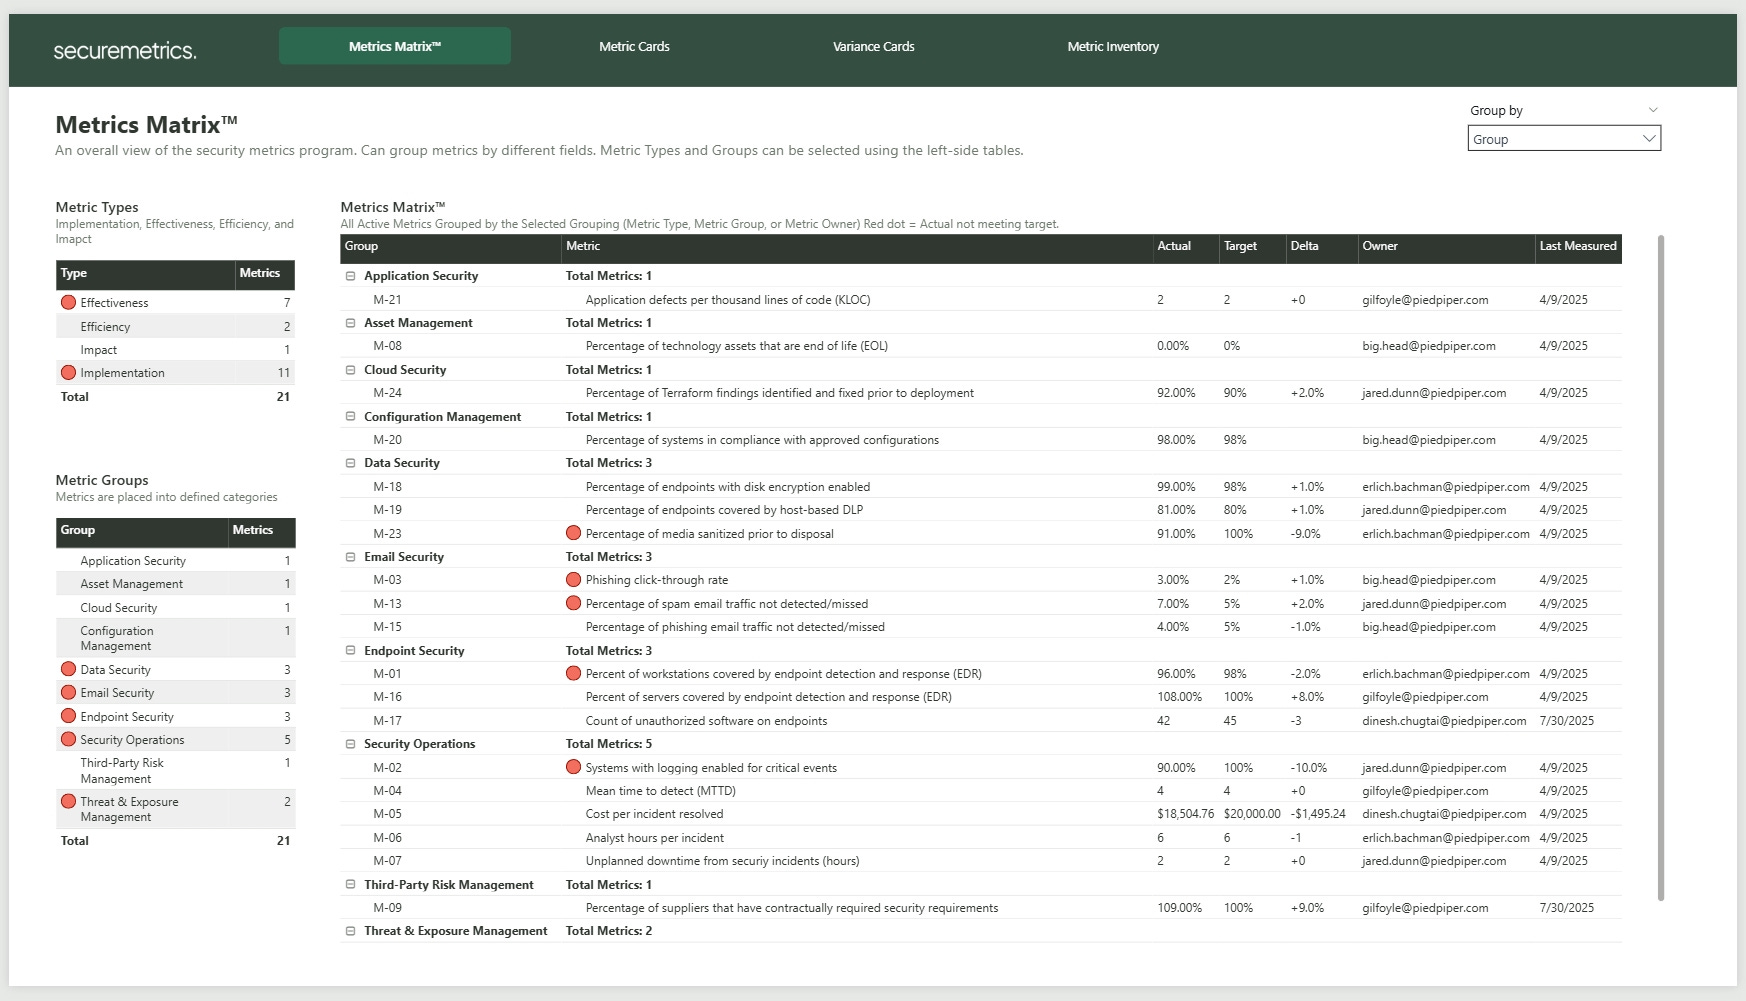
A compact, at-a-glance view of your entire program.
Red action dots highlight metrics falling short of targets.
Group and filter by type, category, or owner.
Quickly spot where attention is needed.
2. Metric Cards
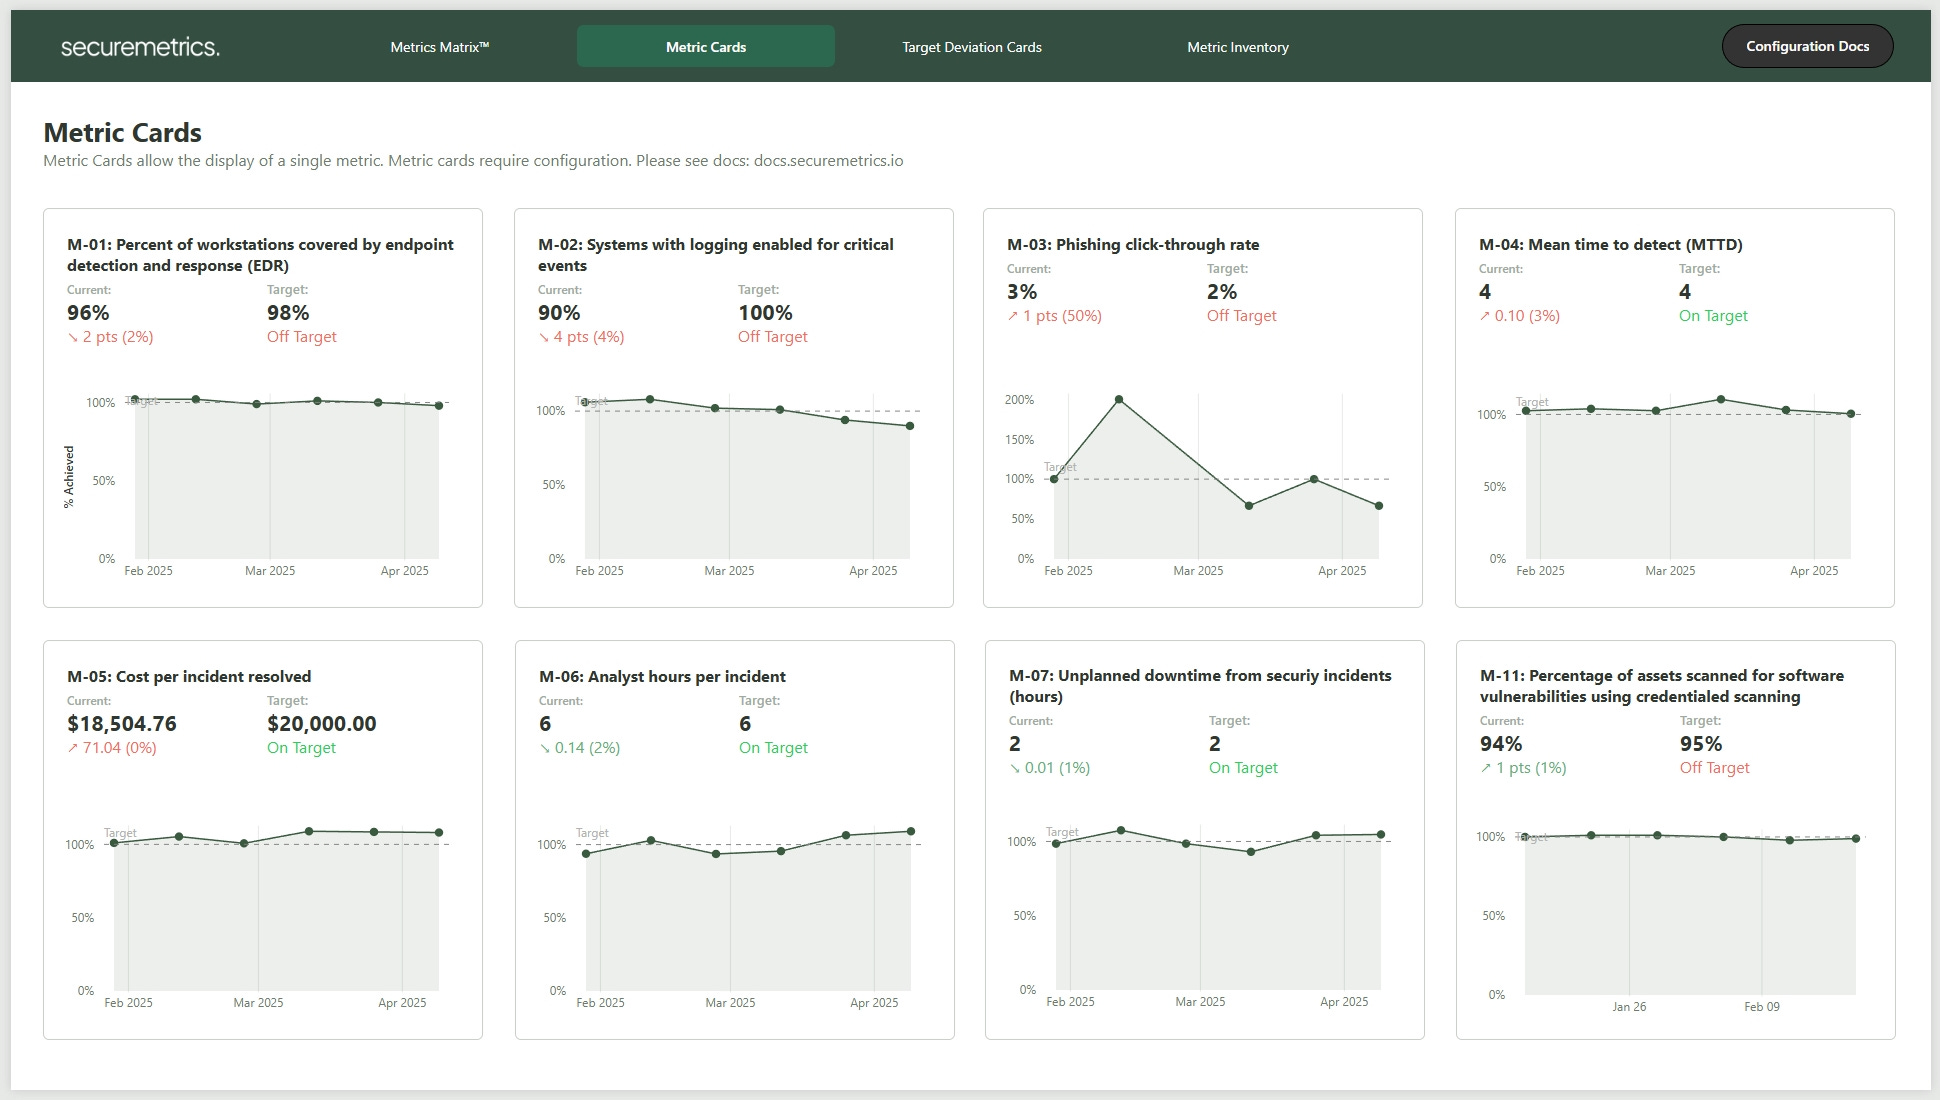
Individual metric dashboards with:
IDs, names, current values, and targets
Change since last measurement
Clear “on/off target” indicators
Mini trend charts showing % of target achieved over time
3. Target Deviation Cards
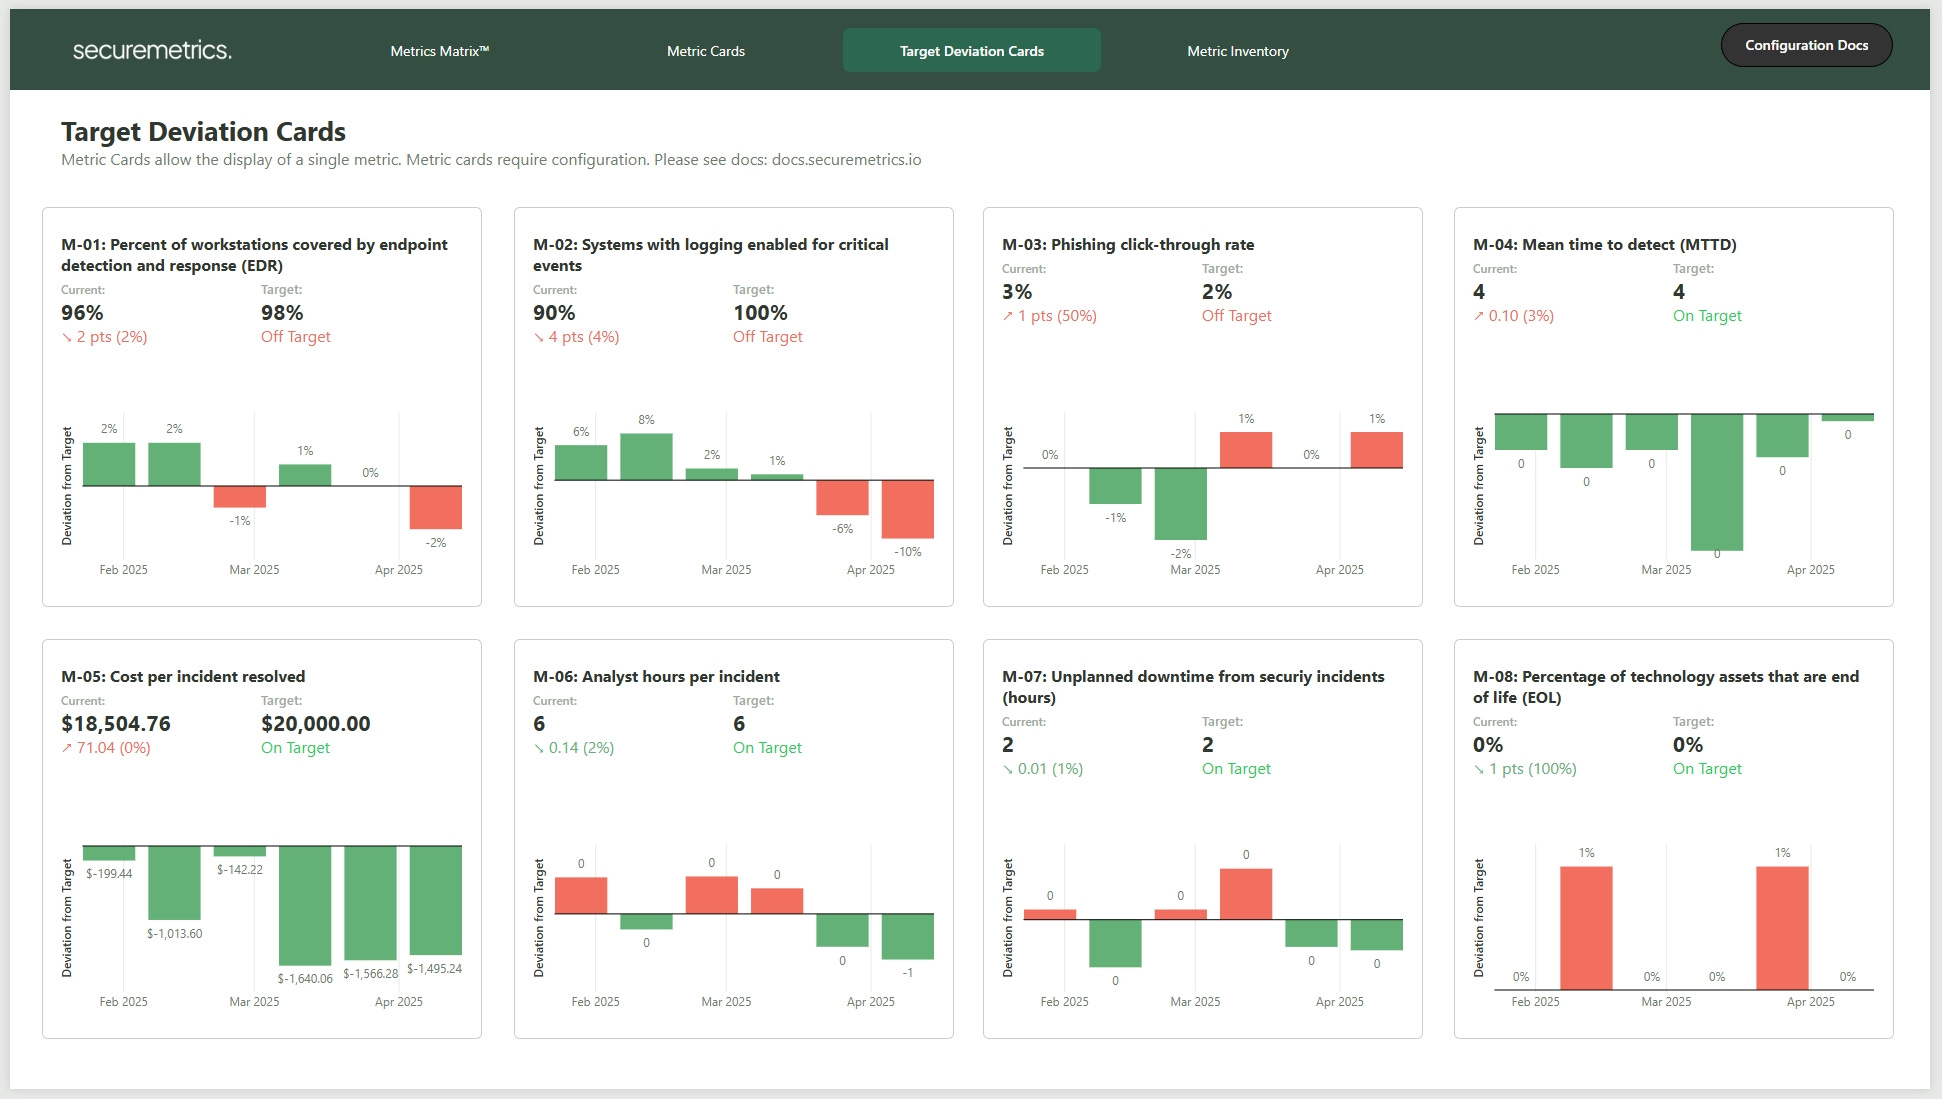
A sharper look at gaps.
Show how far a metric is above or below target
Visualize deviations without being cluttered by raw values
Automatically color-coded by desired direction
These layouts let stakeholders get answers quickly, whether they want the big picture or a deeper dive.
Making Metrics Easy
The purpose of the Security Metrics Toolkit is simple: make running a metrics program easier.
It doesn’t lock you into specific integrations.
It doesn’t prescribe what to measure.
It works with any metric, from any source.
Your job is to pick the right measures for the right reasons. The Toolkit takes care of the rest: structure, consistency, and reporting.
You can grab the Security Metrics Toolkit here, or try it for yourself here.